Setting up our editor (CLion, VS Code) to debug the STM32 ARM chips.
See Part 1 on how to connect to board and Part 2 on how to setup project and OpenOCD for compile and debug
Setting up CLion
Set up project for Rust (that is not covered here) and add default Cargo config. Set "command" to build (else CLion will try to run it in arm qemu).
It should look like this:
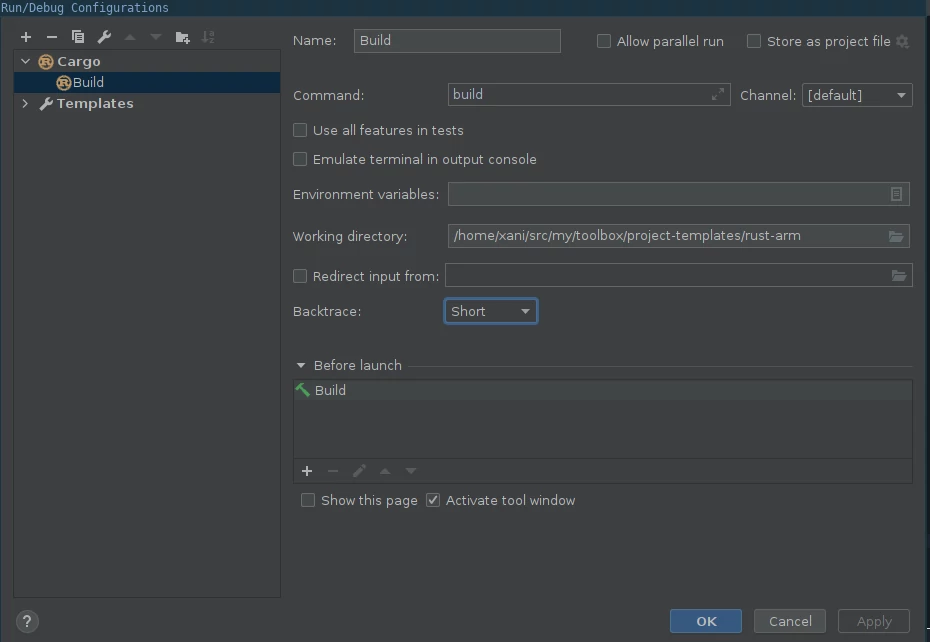
If your project builds from console, it should build from CLion too.
Setting up the openocd link
Go to the "Run -> Edit configurations" again and add "OpenOCD Download & Run" target.
In "Executable" field, point to our compiled ELF file, target/thumbv7m-none-eabi/debug/rust-arm.
In "Board config file", point it to the openocd.cfg file config. Note that the name "board config" here is misnomer as
you need both board & debugger config there, else it tries to connect on default debugger (and most likely fails)
In "Reset", set your preference, I set up "Run" because I usually want that action right after programming it
Then in "Target" add custom build target with "ARM" toolchain; in "Build" add custom command "cargo build" with program set to cargo and command set to build
Should look like this:
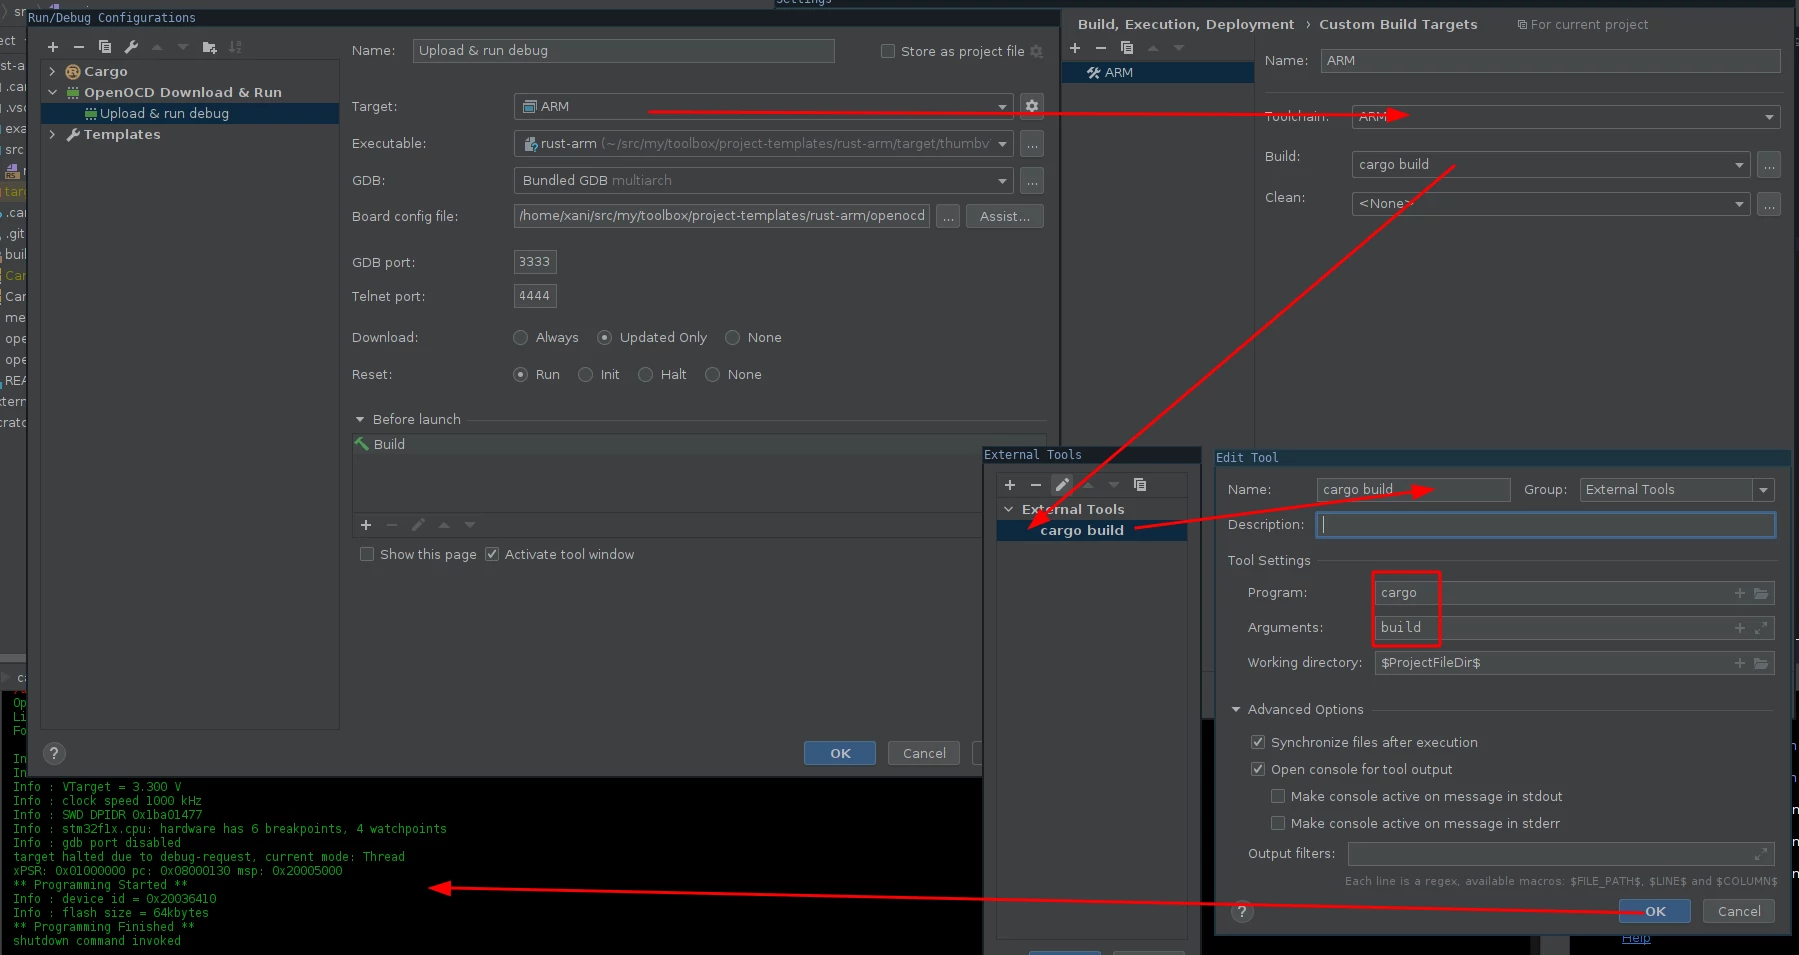
And get same result as would using program command from the commandline.
Now add "GDB Remote Debug" target. set "target remote args" to :3333 and the "Symbol file" to the path to our ELF binary
Run openocd in terminal (I do not know at this point how to make CLion run it automatically), then click the debug button.
Set breakpoint on line that's likely to be running, like blinking part.
You should get something akin to this:
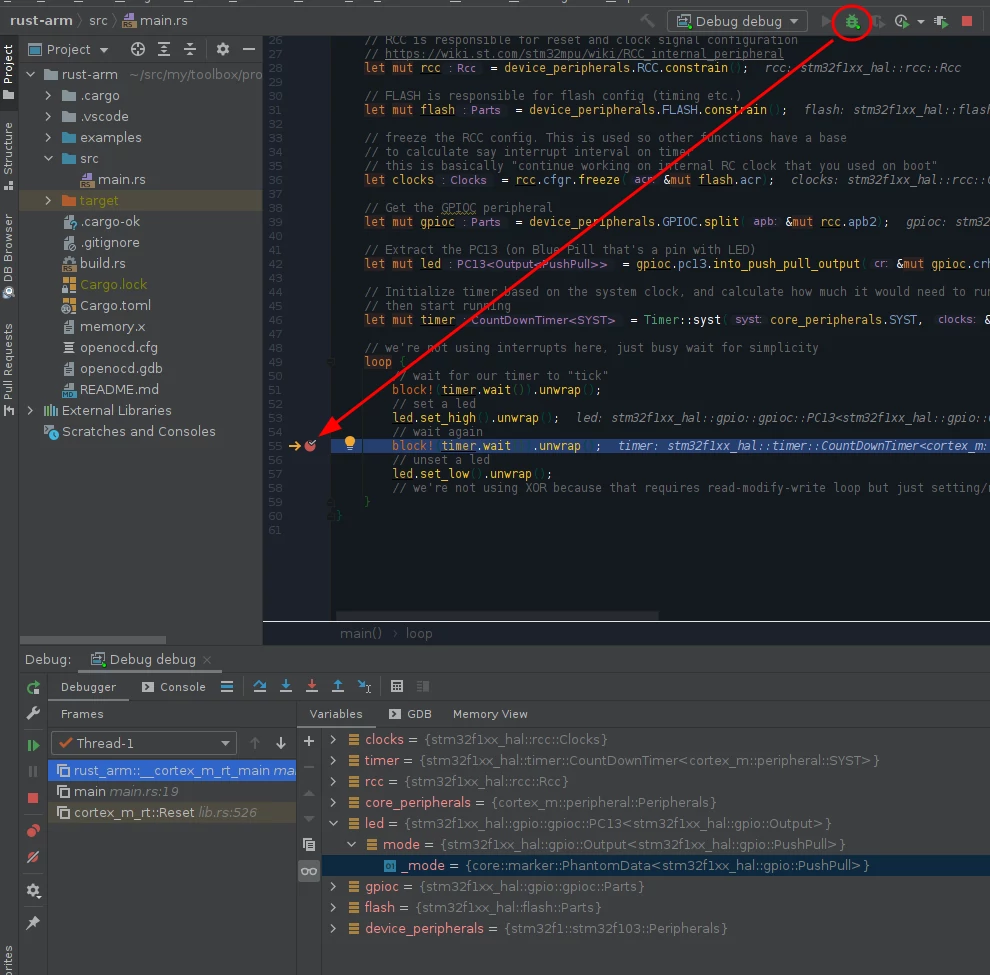
And you should now be able to use the CLion debugger on your piece of hardware. Glorious Purpose!
Setting up Visual Studio Code
The template we use comes with example VS studio code configuration. We will also use "Cortex Debug" plugin.
Sadly the latest version of cortex arm module didn't get the memo about gdb-multiarch being a thing so add
1"cortex-debug.gdbPath": "/usr/bin/gdb-multiarch"
in settings.json
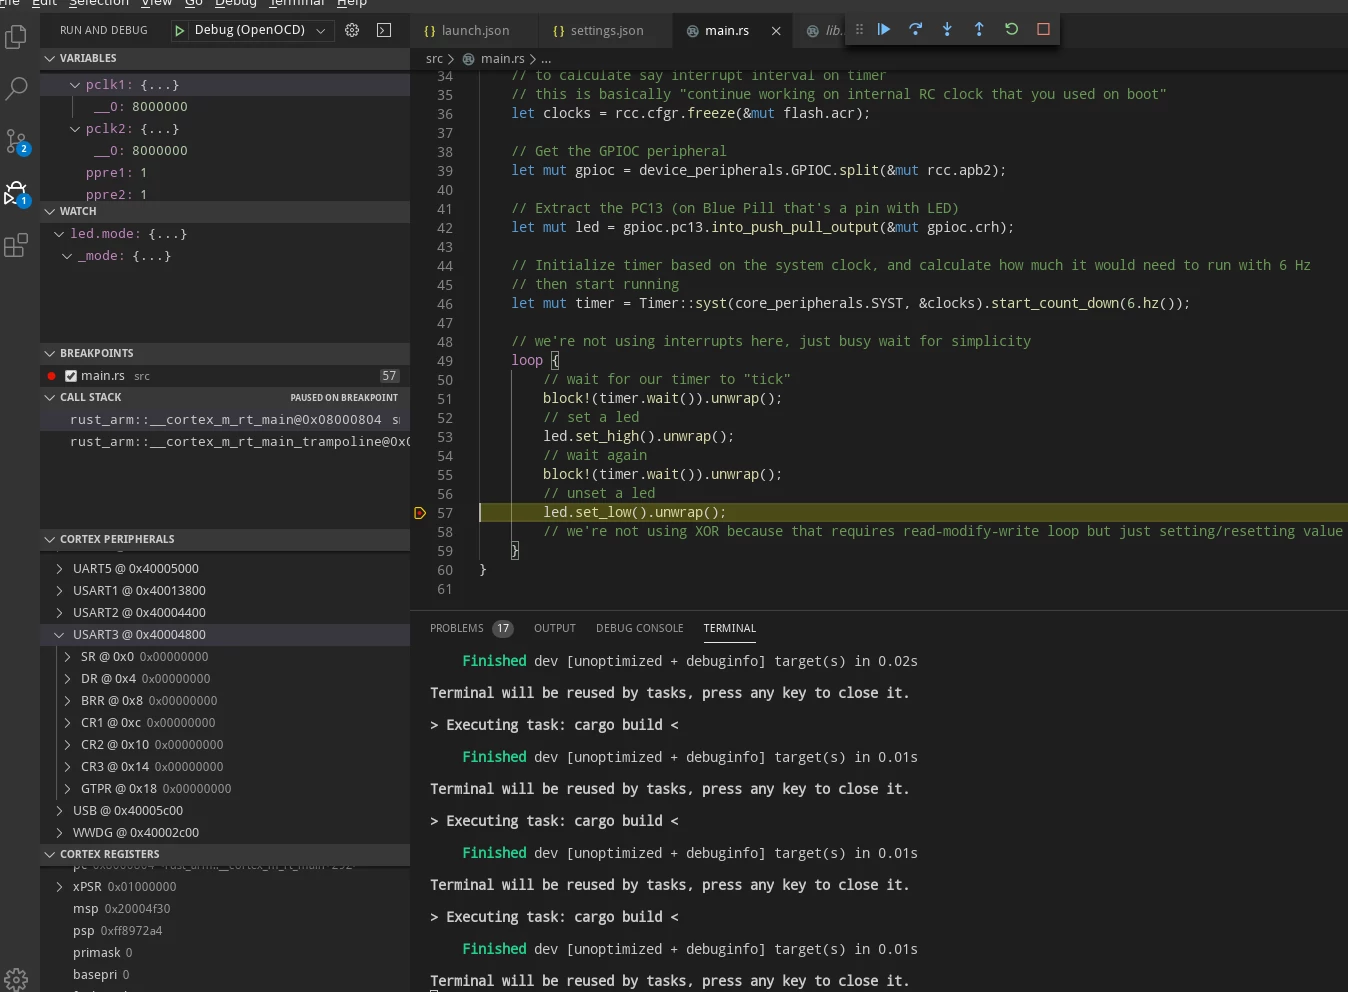
Now we need to setup the board in launch.json
First, we need to get .svd file (peripheral description) for our CPU, I got mine from here
Now, as usual, we need to point it to our openocd.cfg and also tell it what CPU uses. That worked for me:
 1{
 2    /*
 3     * Requires the Rust Language Server (RLS) and Cortex-Debug extensions
 4     * https://marketplace.visualstudio.com/items?itemName=rust-lang.rust
 5     * https://marketplace.visualstudio.com/items?itemName=marus25.cortex-debug
 6     */
 7    "version": "0.2.0",
 8    "configurations": [
 9        {
10            /* Configuration for the STM32F303 Discovery board */
11            "type": "cortex-debug",
12            "request": "launch",
13            "name": "Debug (OpenOCD)",
14            "servertype": "openocd",
15            "cwd": "${workspaceRoot}",
16            "preLaunchTask": "Cargo Build (debug)",
17            "runToMain": true,
18            "executable": "./target/thumbv7m-none-eabi/debug/rust-arm",
19            "device": "STM32F103C8T6",
20            "configFiles": [
21                "${workspaceRoot}/openocd.cfg",
22            ],
23            "svdFile": "${workspaceRoot}/.vscode/STM32F103xx.svd",
24            "swoConfig": {
25                "enabled": true,
26                "cpuFrequency": 8000000,
27                "swoFrequency": 2000000,
28                "source": "probe",
29                "decoders": [
30                    { "type": "console", "label": "ITM", "port": 0 }
31                ]
32            }
33        }
34    ]
35}
and it should "just work":
I'm not using VS Code that much so I dunno how to make it program the MCU "VS code way",
but easiest way is probably to make a .sh script doing "compile && program" and then call it as task.
And that is all. Happy Oxidizing! This is end of this miniseries, another one might come up