Setting up tooling and development hardware for Rust on the ARM (STM32 CPUs)
What hardware do we need?
- Dev board. Just about any will do, Blue Pill is pretty popular, other option is one of the STM32 Discovery boards that come with the programmer.
- Programmer/debugger - any of the ST-Link (or clones) will do, here we will be using ST-Link V2 clone. Really, anything supported by openocd is fine, altho some need some tweaking
- Power supply for a dev board - a lot of them just accept micro-USB connector
Most dev boards come with some example code, the barebones often just have LED blinking, but I've seen some that even output on USB.
The more sophisticated ones that have extra peripherals usually come with demo of them so you might want to plug them before doing anything else to have a look.
Connecting dev board to debugger
Bare minimum connection required between the debugger and the board is 4 pins for the SWD (Serial Wire Debug) protocol
GND- self explanatorySWDIO- bidirectional data portSWCLK- clock3.3v- it is used by debugger to sense what voltage range the CPU is requiring - essentially so debugger won't blow up some of the 1.8v powered CPUs with 3.3v
Then there are extras like
RESET- hardware reset for a board, recommended if your board have it conveniently placedSWO- trace output pin - won't be needed now but it is used during debug
If your board only has that, look at pinout and use female-female jumper wire to connect it to the debugger.
Some boards have one 10- or 20-pin JTAG connectors (JTAG is more generic way to debug devices), the pins required for SWD are shared with JTAG pinout.
If your board and programmer have compatible connectors you can just connect them:
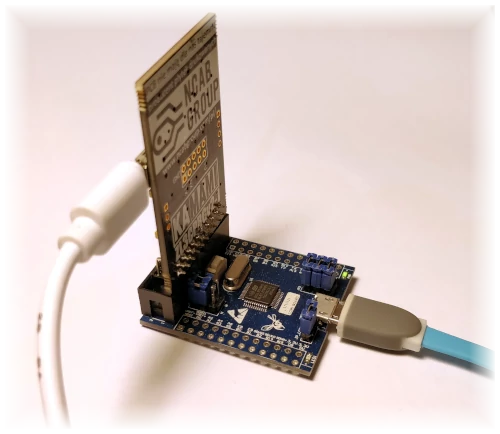
Else you either have to look at pinout and use a bunch of jumper wires, or use an adapter and ribbon cable ( google "jtag adapter", aliexpress is full of it for few bucks, but if you don't want to feed the chinese making one isn't too complex).
Getting board with builtin debugger like one of the STM32 Discovery series saves you the hassle, most of them can also act as debugger on their own after disconnecting few jumpers.
Either way, debugger should report itself in sudo dmesg:
1[21826.278654] usb 2-11: new full-speed USB device number 7 using xhci_hcd
2[21826.431991] usb 2-11: New USB device found, idVendor=0483, idProduct=374b, bcdDevice= 1.00
3[21826.431995] usb 2-11: New USB device strings: Mfr=1, Product=2, SerialNumber=3
4[21826.431997] usb 2-11: Product: STM32 STLink
5[21826.431999] usb 2-11: Manufacturer: STMicroelectronics
Connect the dev board with the debugger when both are turned off, then plug them in to USB. That should be everything you need to do on the hardware side
Setting up the software
OpenOCD
OpenOCD is a daemon that facilitates communication between the programmer/debugger and apps wanting to use it. It talks on:
3333- gdb remote4444- telnet interface for CLI6666- builtin tiny Tcl implementation for scripting
It basically is used to translate debugger quirks into common interface for the rest of apps wanting to use it.
Install OpenOCD package, it should be in most distros sudo apt install openocd. Now you need 2 things to make it work:
- Interface config - what debugger you're using
- Target config - what kind of CPU you're connecting to.
On most distros you will get a lot of ready-made configs in /usr/share/openocd/scripts/interface/ and /usr/share/openocd/scripts/target/
So to verify that connection is working, pick a programmer and a board via CLI -f option (which basically does include):
1openocd -f interface/stlink.cfg -f target/stm32f3x.cfg
(note that openocd allows you to omit the default /usr/share/openocd/scripts path), and you should be all set:
 1Open On-Chip Debugger 0.11.0-rc2
 2Licensed under GNU GPL v2
 3For bug reports, read
 4	http://openocd.org/doc/doxygen/bugs.html
 5Info : auto-selecting first available session transport "hla_swd". To override use 'transport select <transport>'.
 6Info : The selected transport took over low-level target control. The results might differ compared to plain JTAG/SWD
 7Info : Listening on port 6666 for tcl connections
 8Info : Listening on port 4444 for telnet connections
 9Info : clock speed 1000 kHz
10Info : STLINK V2J24M11 (API v2) VID:PID 0483:374B
11Info : Target voltage: 5.743197
12Info : stm32f3x.cpu: hardware has 6 breakpoints, 4 watchpoints
13Info : starting gdb server for stm32f3x.cpu on 3333
14Info : Listening on port 3333 for gdb connections
The configs generally cover whole family of CPUs so for example for STM32F1xx (like the Blue Pill) you'd use target/stm32f1x.cfg.
If that doesn't work, verify the connections again and check whether you have right interface and CPU picked up. On Discovery boards you're supposed to use one of the stlink* ones (usually just stlink.cfg) as they have that debugger built-in.
If it does, IT IS DONE. Now put an openocd.cfg file in the root of your project dir:
1# STLINK v2
2source [find interface/stlink.cfg]
3
4# Generic STM32F373 dev board
5source [find target/stm32f3x.cfg]
and just calling openocd in that directory should get it running. At this point we can also telnet into openocd:
1-> ᛯ telnet 127.0.0.1 4444
2Trying 127.0.0.1...
3Connected to 127.0.0.1.
4Escape character is '^]'.
5Open On-Chip Debugger
6> reset run
7Unable to match requested speed 1000 kHz, using 950 kHz
8Unable to match requested speed 1000 kHz, using 950 kHz
(you can exit telnet session via C-[, then typing quit in telnet> prompt, or just by typing exit in openocd prompt)
Oh my! Something is happening!. We see that openocd dropped the speed of the link. Why ? There can be many reasons, one of which is CPU using integrated RC oscillator which have pretty low accuracy but is default clock source on boot.
But it apparently auto-adjusted for that, and if all gone well, executed reset run command which does exactly what it says.
At this point if board had already code loaded in, it should start running.
If for some reason you can't get communication running it might help to hold reset during powering on, some demos put CPU in low power mode that disables the debug interface lines. Also the reason why I recommended connecting the RESET line if all possible, so debugger can do it on its own.
So, it works, what next ? Let's do something with it! type
1> flash banks
2#0 : stm32f3x.flash (stm32f1x) at 0x08000000, size 0x00040000, buswidth 0, chipwidth 0
3
4> flash probe 0
5device id = 0x20006432
6flash size = 256kbytes
7flash 'stm32f1x' found at 0x08000000
To see list of flash areas (weird bug here, it is showing stm32f1x even tho I'm using it on stm32f3x series CPU)
and get the address (0x08000000) and size (0x00040000) of one of them (this chip only has one). We now know address so we can start downloading it:
1> dump_image /tmp/image.bin 0x08000000 0x00040000
2dumped 262144 bytes in 7.244324s (35.338 KiB/s)
Not a speed demon by any means, but if CPU have no read protection fuses set you should now have its flash content written to a file for safekeeping (if for some reason you miss the blinky).
This is just a sanity check, as we most likely won't be using any of it directly but you can use same interface to write or erase the flash.
The next part will cover creating Rust project and getting some code going.